- DATE:
- AUTHOR:
- RedBrick AI team
Improved access control, refreshed personal dashboard & comment pinning on viewports!
Happy New Year, all! I hope everyone had a relaxing holiday season and a smooth start to 2023.
Over the last few weeks, we made meaningful improvements to how Admins control permissions & provide feedback/communicate with annotators and refreshed the default dashboard for annotators.
Introducing Project Admins
In response to several customer requests, we have improved our access controls and introduced a new Project Admin role to perform key administrative tasks for individual projects.
As described by the graphic below, all organization admins are added as project admins to all projects. Organization members can be added to select projects as either project members or project admins.
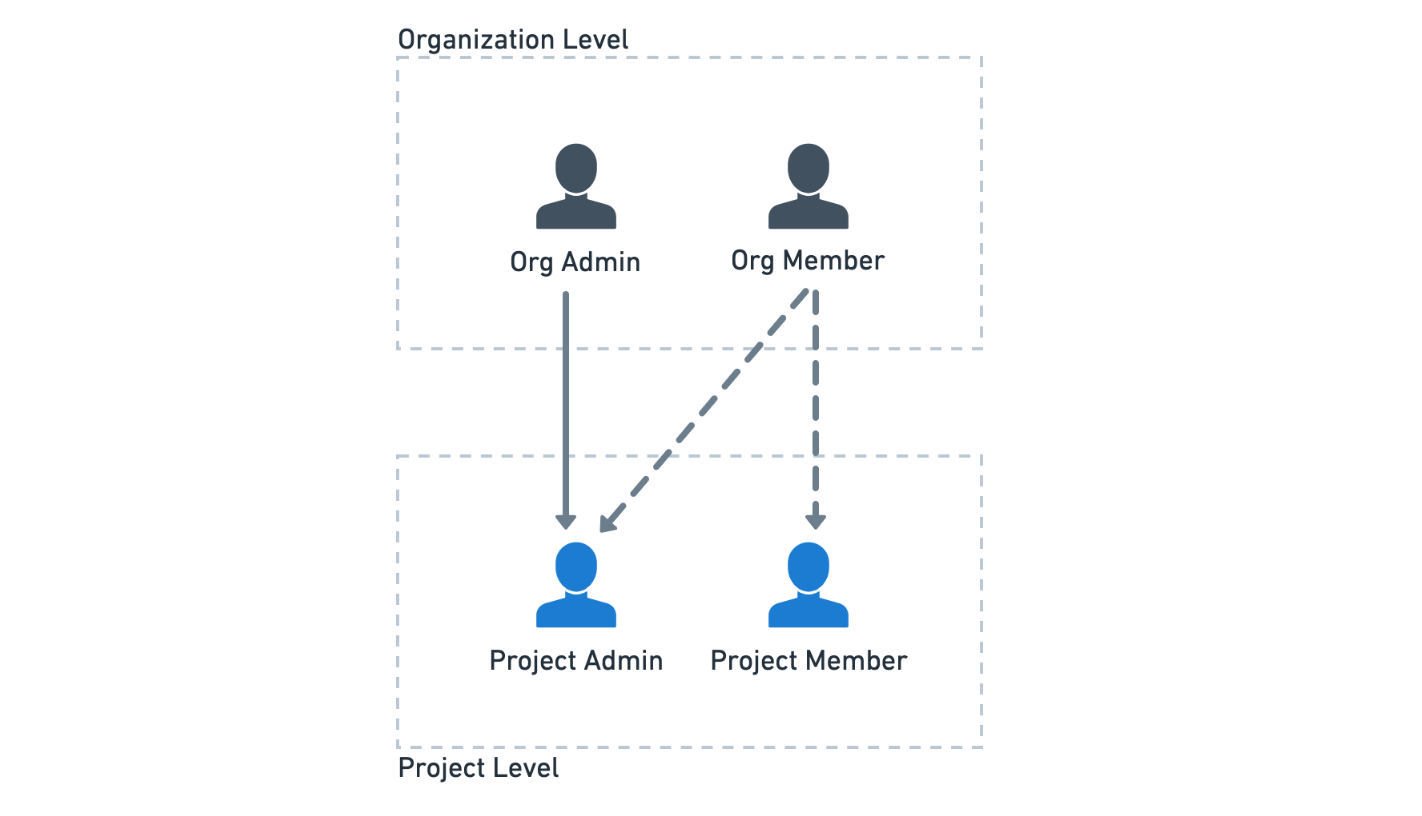
Project Admins can perform administrative tasks like uploading data, assigning tasks, modifying project settings, etc.
Project Members can only annotate and/or review the tasks that are assigned to them.
Pin Comments on Viewports
Previously when providing feedback or asking questions using the labeling tool Comments, you had to explain in the text where in the image to focus (for example, "Please correct the nodule segmentation on the top-left corner of the 122nd slice.").
You can now add a "pin" to any comment referencing a location on any viewport.
Along with the ability to pin comments, we've introduced the ability to resolve comments (the tick button next to the comment). Annotators & reviewers will be warned of submitting tasks with unresolved comments.
Improved Personal Data Dashboard
Project annotators have been asking for a streamlined view of the tasks that are relevant to them. With the new data dashboard, we provide key statistics and actions that will serve as a home base for all annotators.
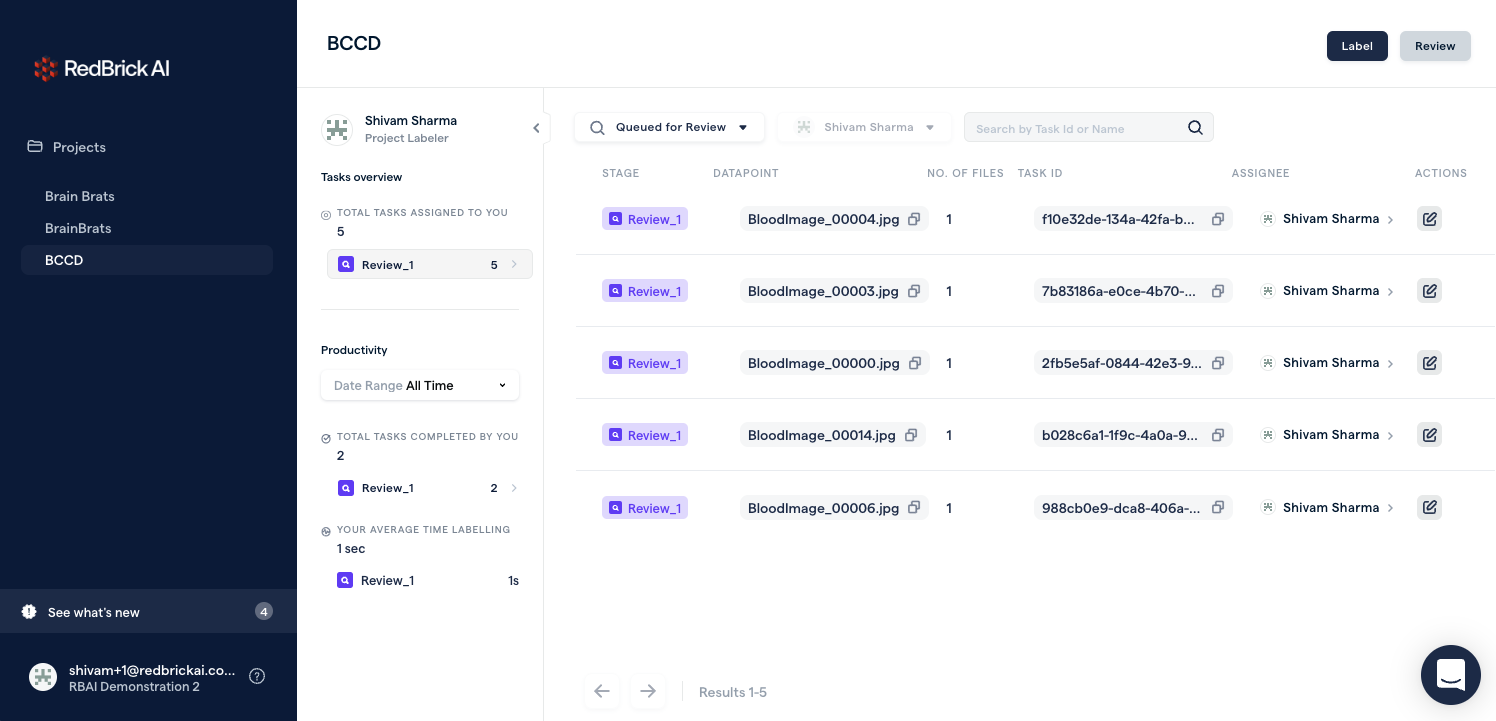
Annotators (Project Members) will see a dashboard with key statistics and filters on the left and a table of relevant tasks on the right. The dashboard will cover the following:
data you've labeled/reviewed.
tasks that are assigned to you.
your average efficiency/productivity.
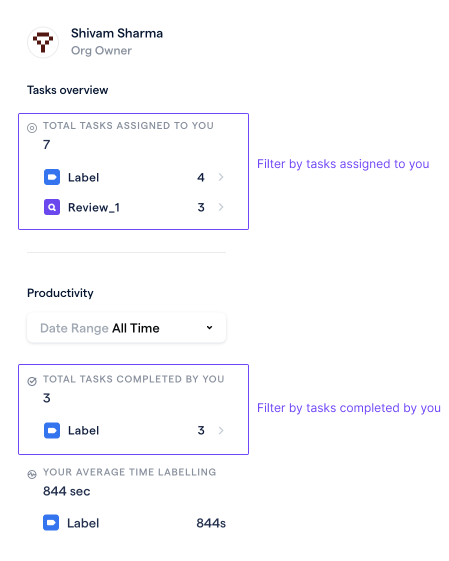
For Project Admins, the left column will contain only personal statistics (information about what the admin has personally annotated/reviewed), and the table will contain information about all tasks in the project.
Ellipse and rectangle ROI tools (Beta)
We have added the ability to make elliptical and rectangle measurements. With these tools, you can get area and voxel intensity (minimum, maximum, average) information about the region of interest. This is a beta release - if you're interested in using these tools in a production project, reach out to us!